JULIET CROWTHER, MA BY RESEARCH JAN 2017 – JAN 2019
RAW DATA BAR CHARTS FOR PRACTICE LED RESEARCH
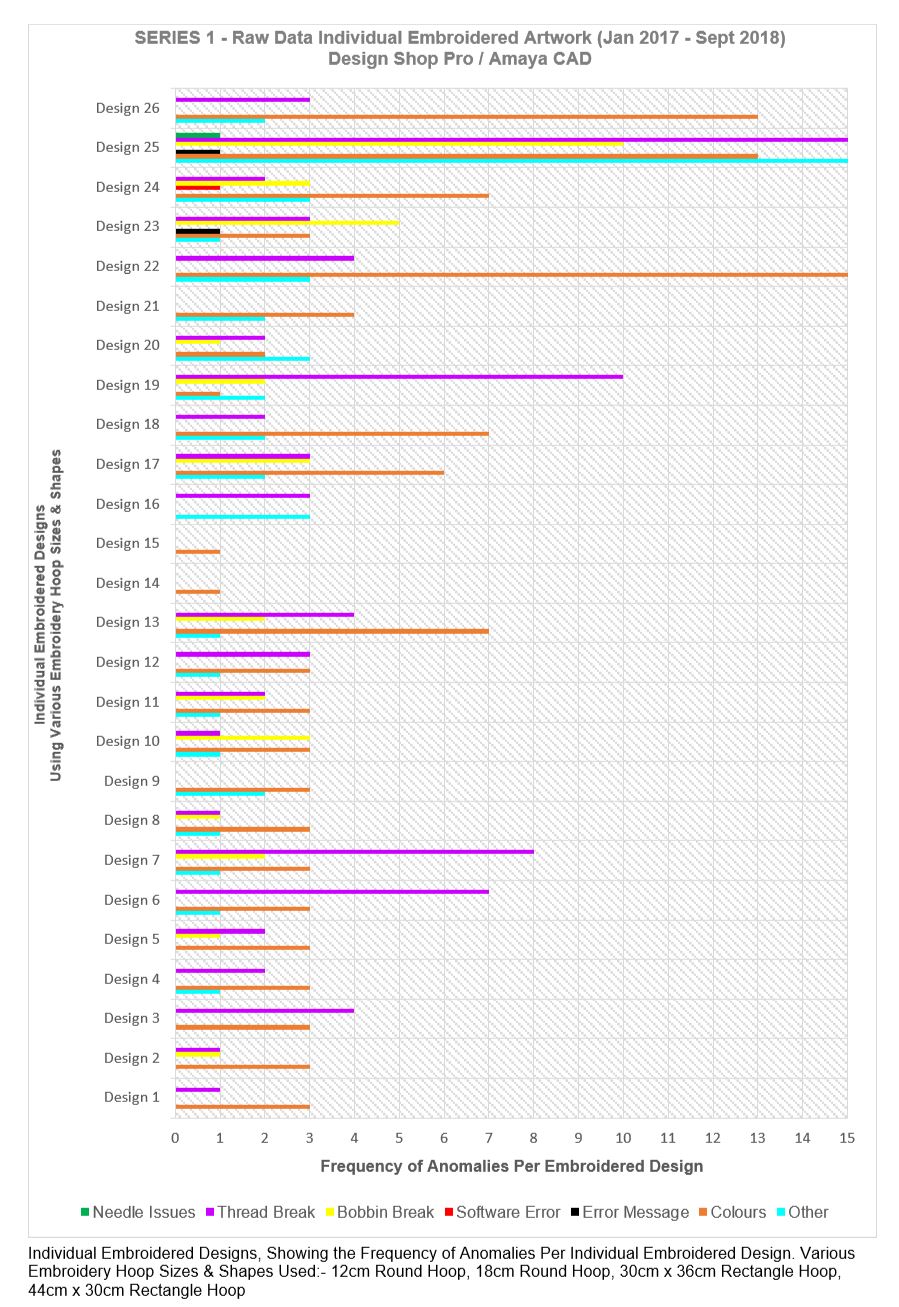
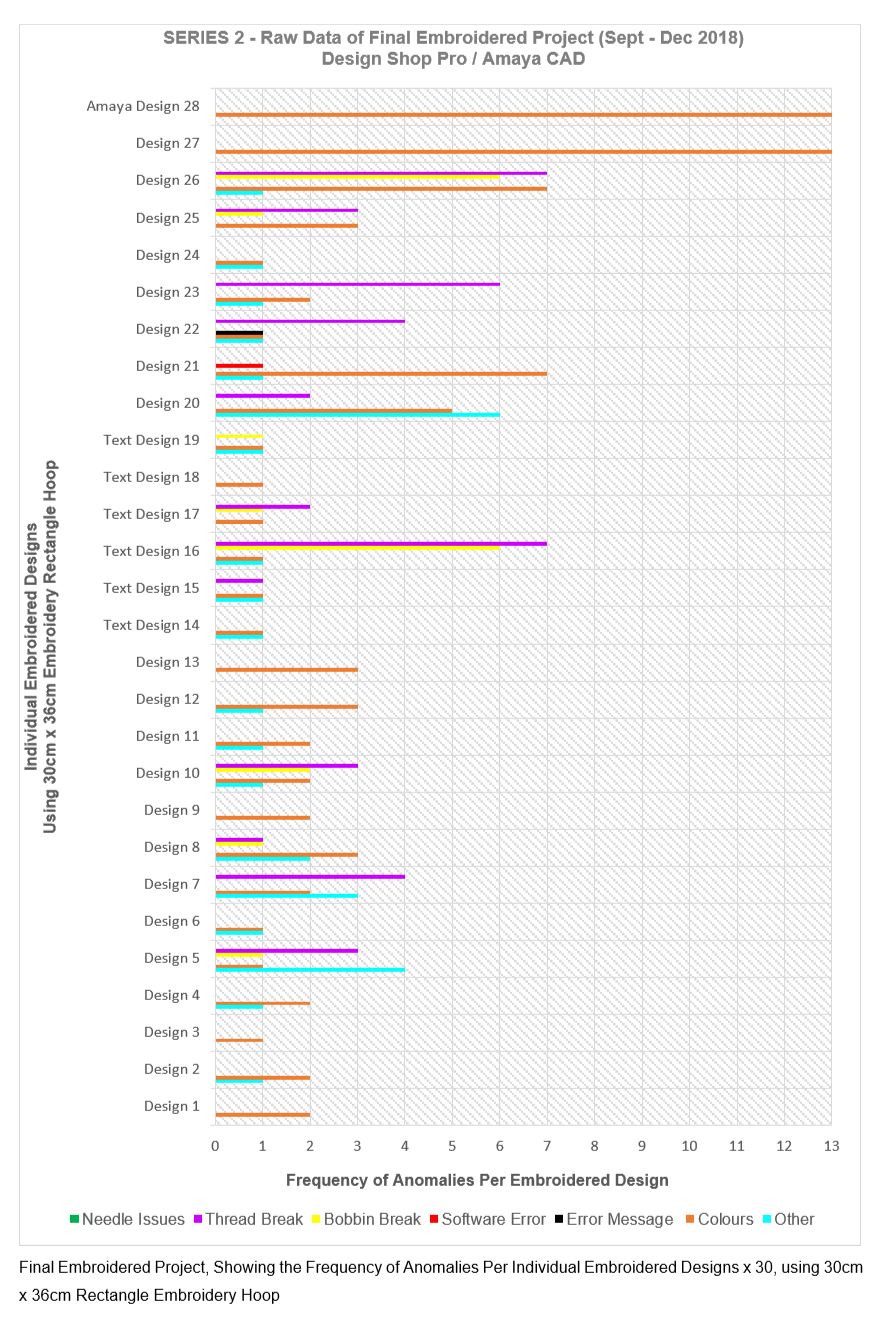
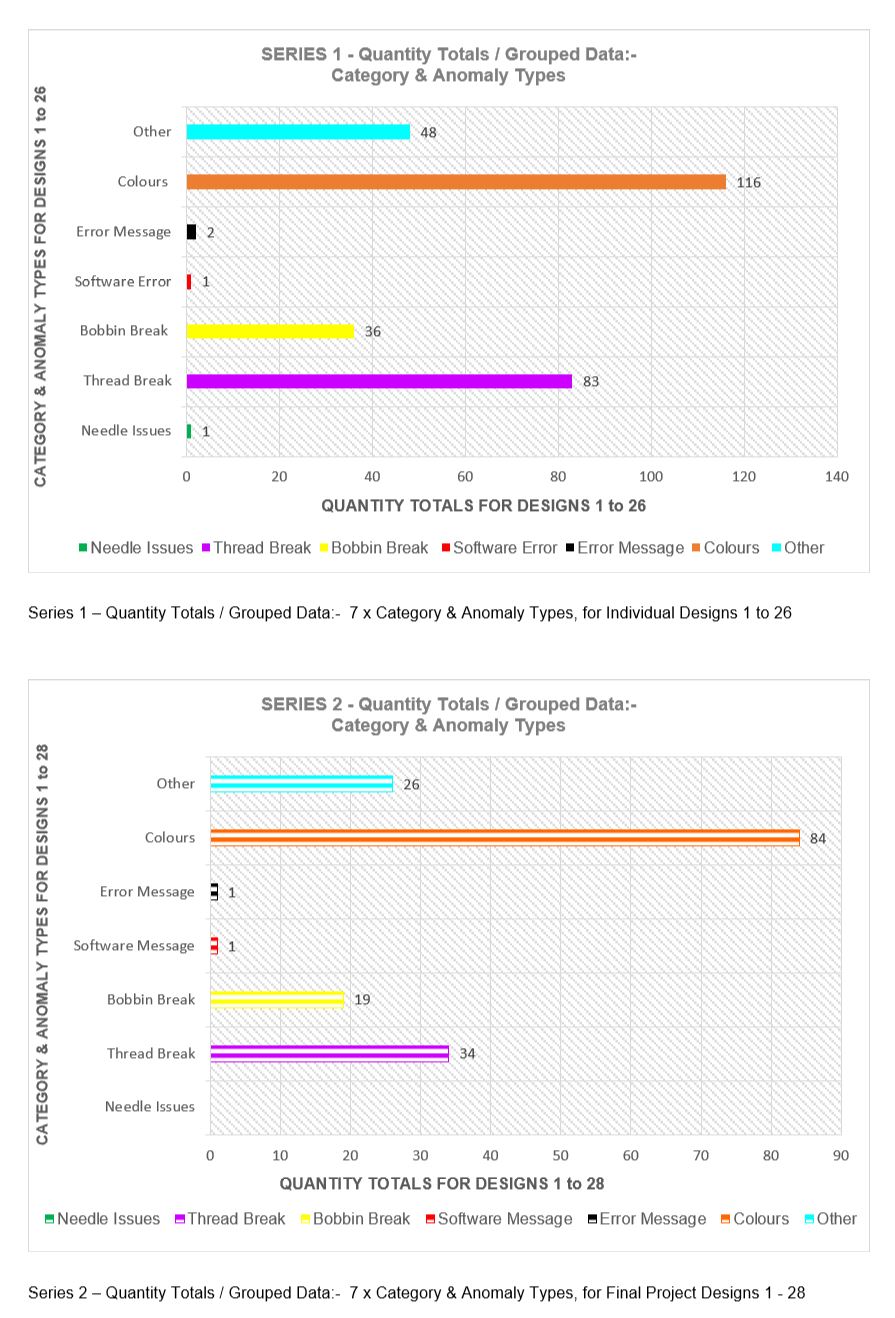
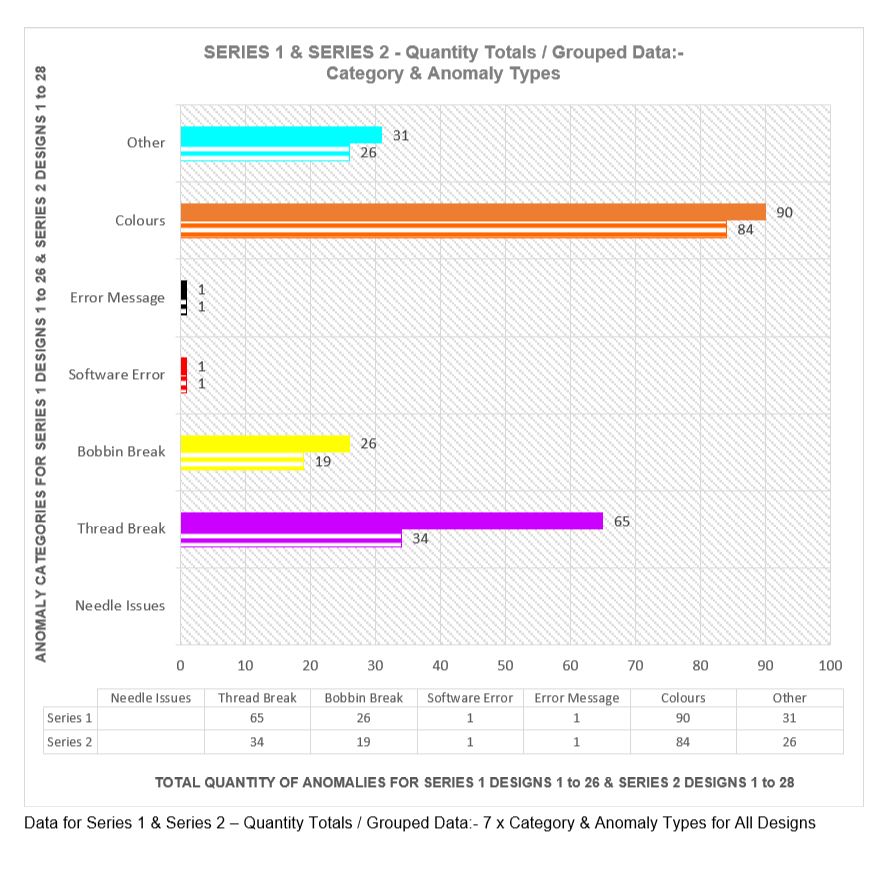
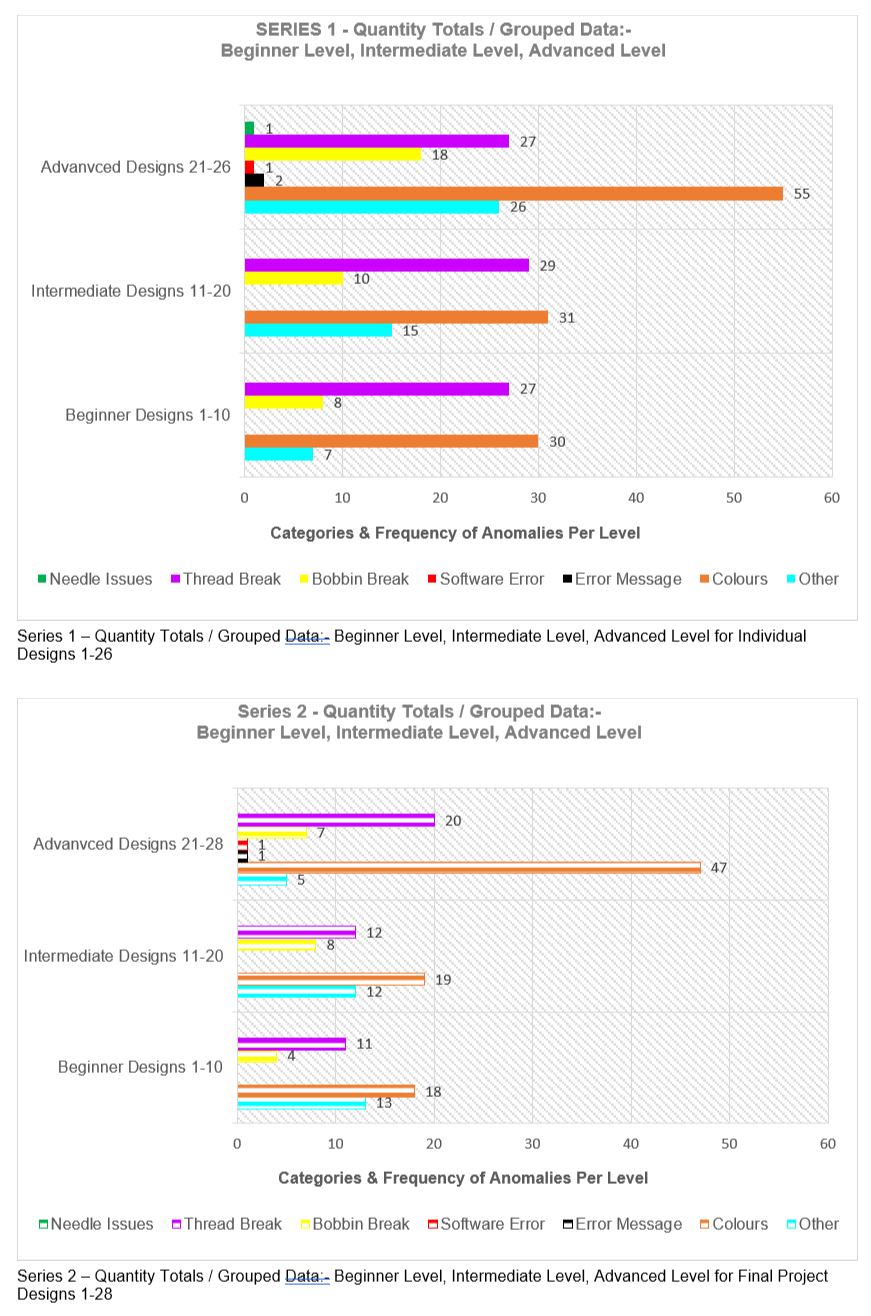
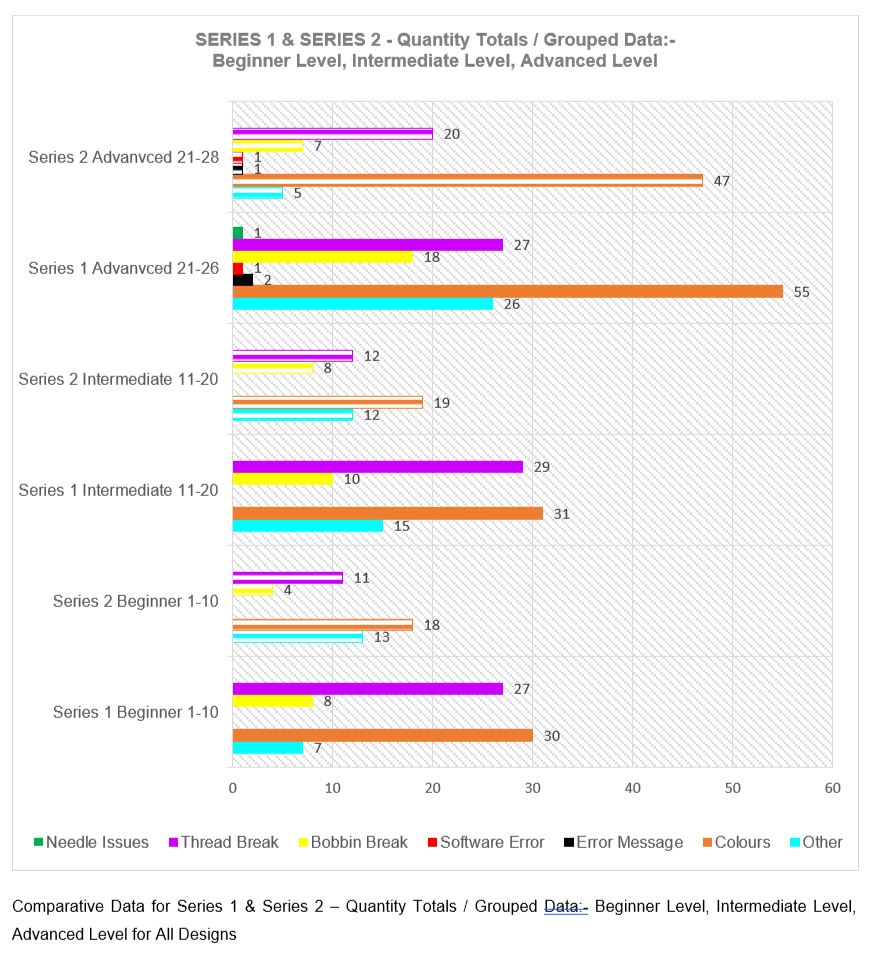
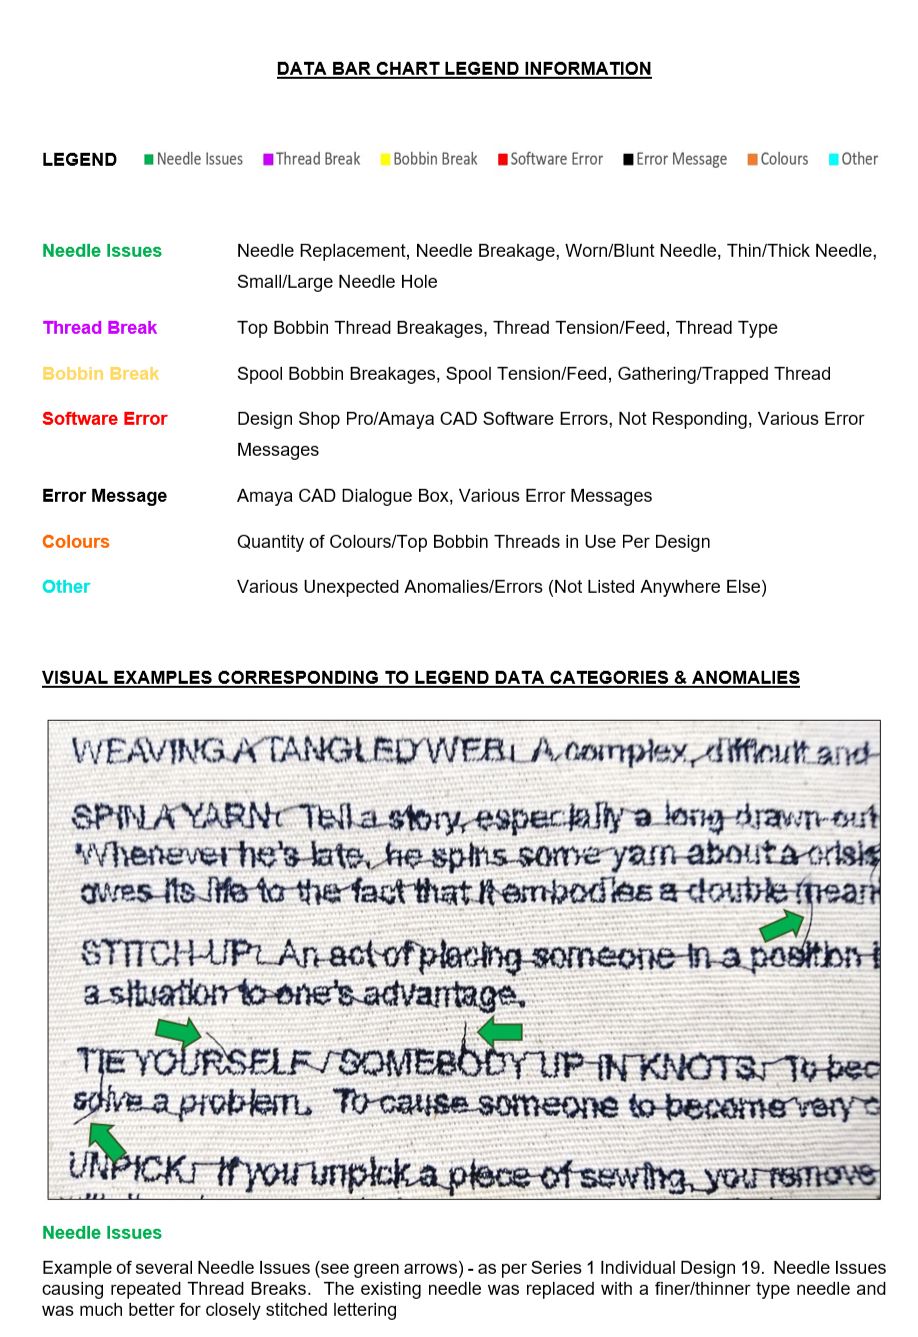
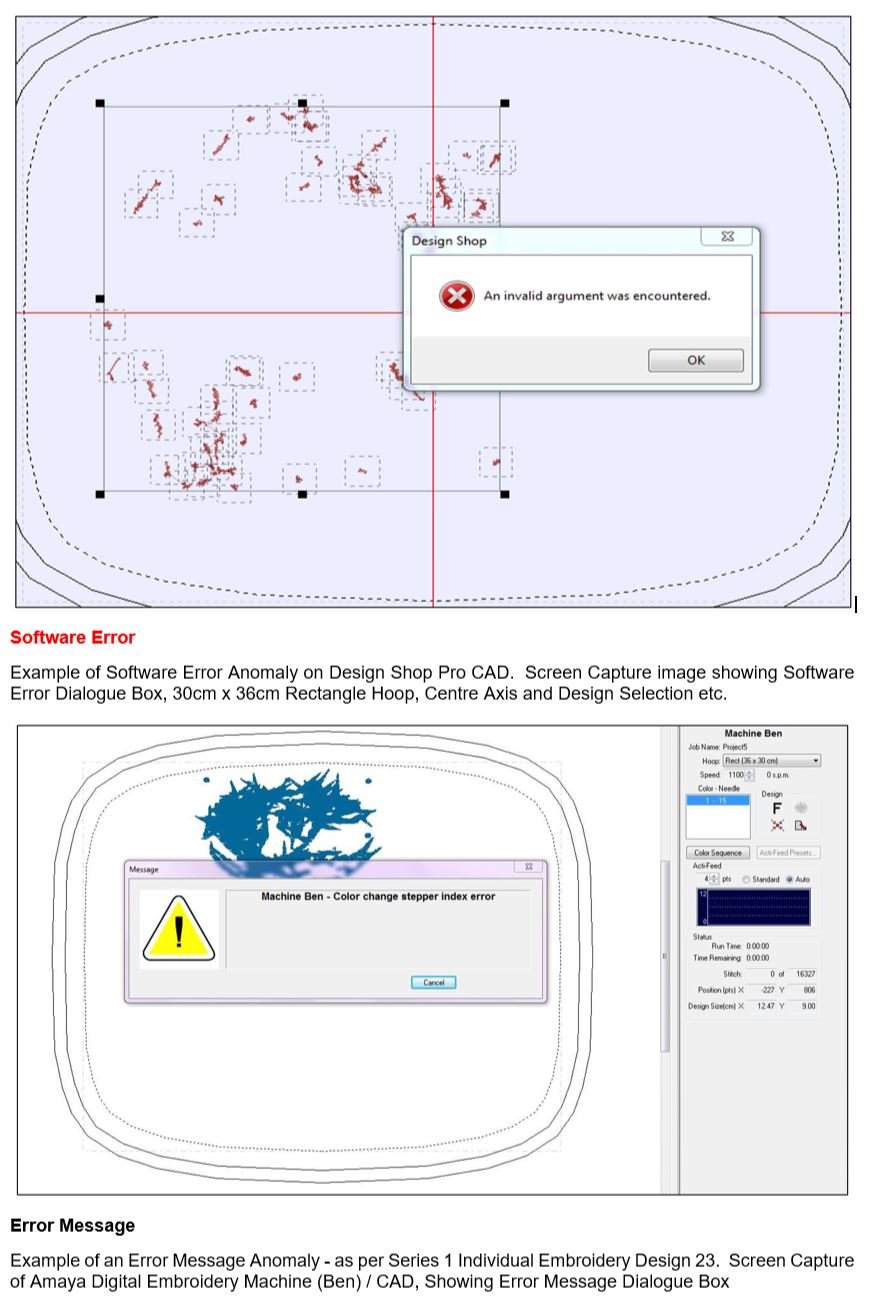
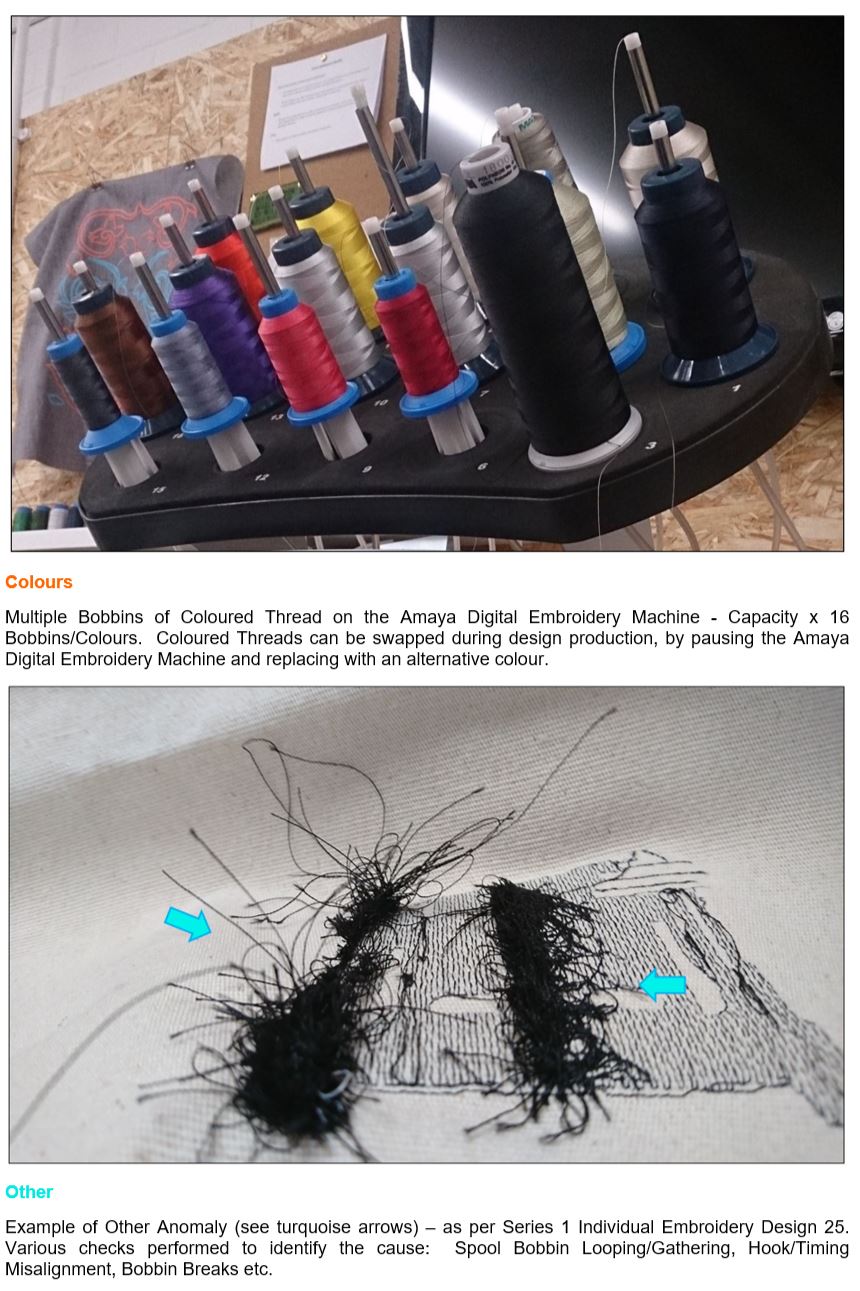
Collection of Raw Data taken from Series 1 Individual Embroidered Artworks (January 2017 to September 2018) and Series 2 Final Embroidered Project (September 2018 to December 2018). Series 1 & 2 Embroidered Artworks were produced via the industrial quality Amaya Digital Embroidery Machine and CAD / Design Shop Pro Software, at the University of Huddersfield as part of my practice led MA by Research studies. Series 1 and Series 2 Embroidered Artworks, both incorporate Beginner Level, Intermediate Level and Advanced Level Designs. Each individual embroidered design was detailed and recorded via notation, screenshot, photograph, movie clip and then this collected raw data was subsequently compiled into bar chart format. The purpose of the collected raw data is to show contrast and comparisons between levels of understanding and ability, manual and digital performance, process/outputs/yields/productivity and Human/Machine interaction (Symbiotic Relationship). The Data Findings of Series 1 Embroidered Artworks are relatively similar in comparison to the Data Findings of Series 2 Embroidered Artworks – thus indicating that advanced level design and familiarity of the process, does not necessarily guarantee consistent, successful outputs. However, the Anomalies remain consistent at each level of design, when comparing Series 1 and Series 2 Embroidered Designs.